For engineering leaders who need answers, not dashboards
See Why Features Aren't Shipping Faster
Get your cycle time breakdown, PR bottlenecks, and team health score in 5 minutes - from GitHub data you already have.
Teams find their first bottleneck within 5 minutes of connecting
“We found a third of our PRs were idle. Review time went from 3 days to same-day.” - Sarah M., VP Engineering at a 120-person SaaS company
Your Engineering Black Box
"I'm managing by gut feel and it's starting to show."
"Here's exactly where we can improve and why."
DORA Research: Why engineering visibility matters
Source: DORA State of DevOps Report
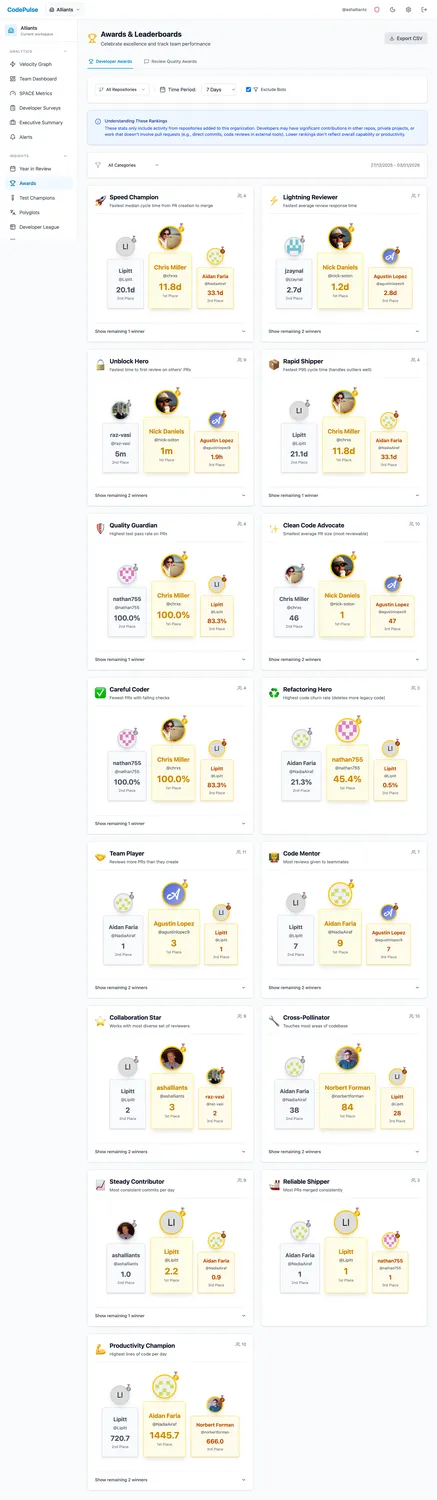
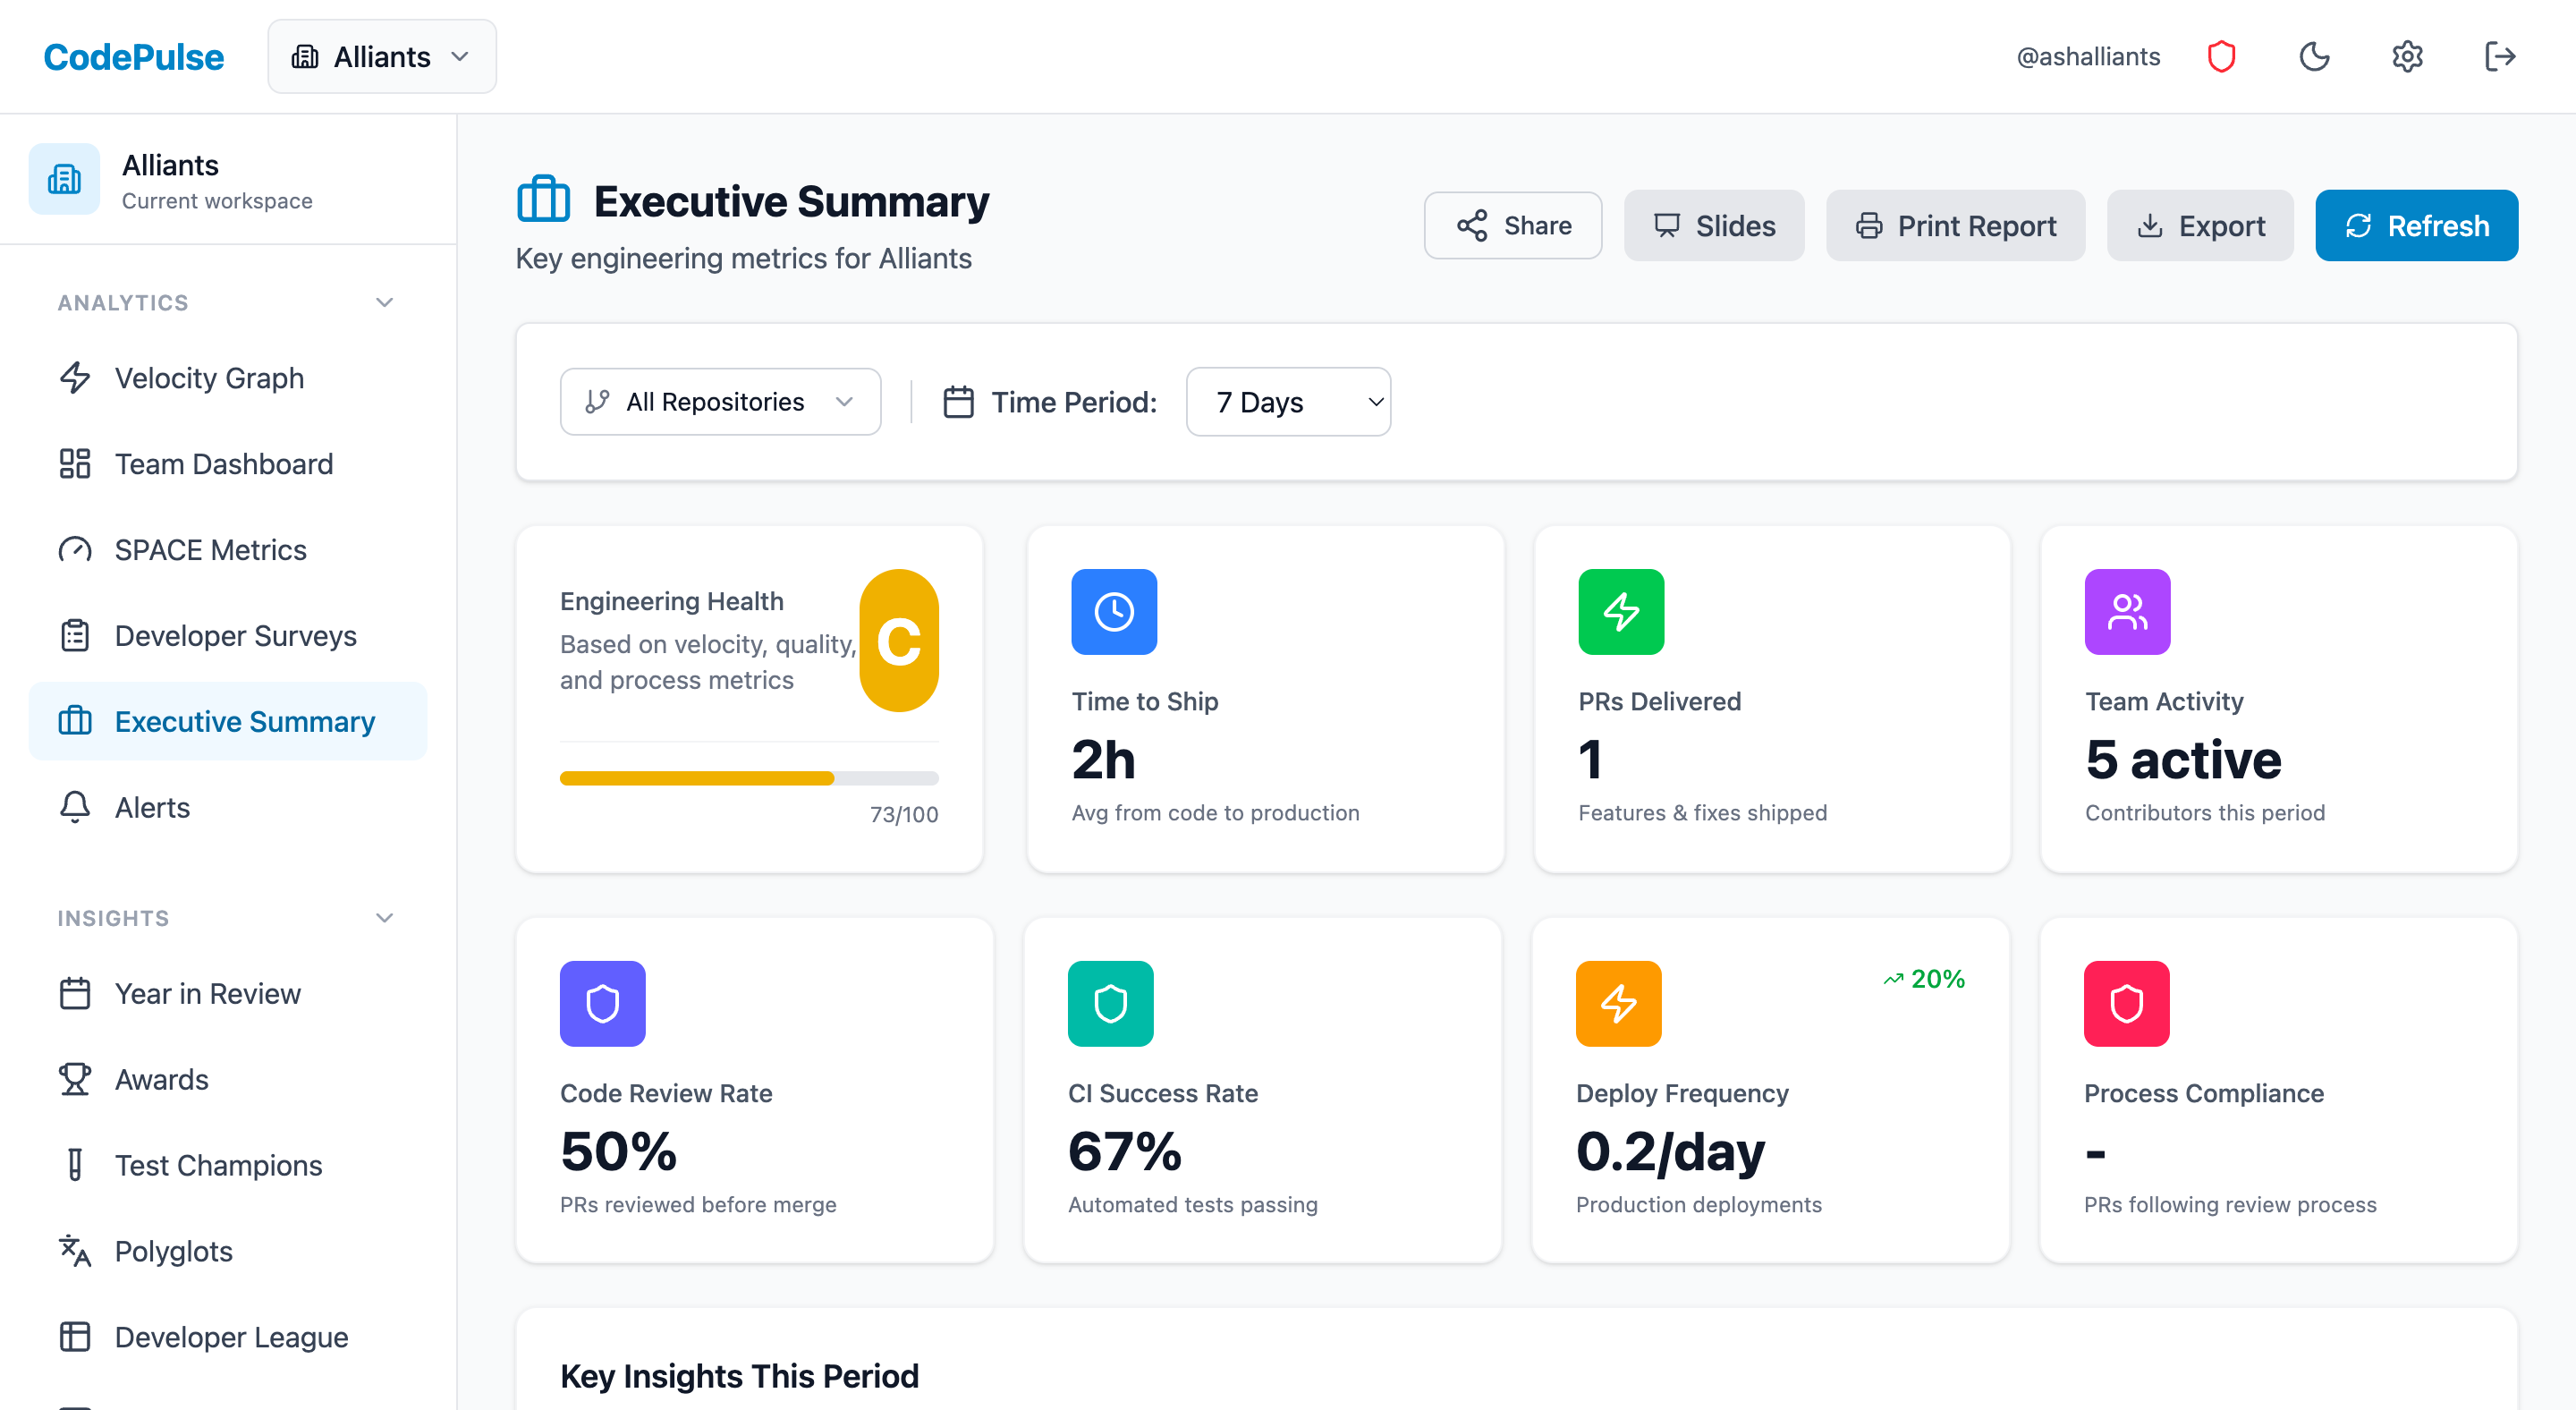
See CodePulse in Action
A 90-second walkthrough of your engineering health dashboard
See your team's velocity in 90 seconds
No signup required
What You'll See in 15 Minutes
Connect GitHub and instantly unlock these insights
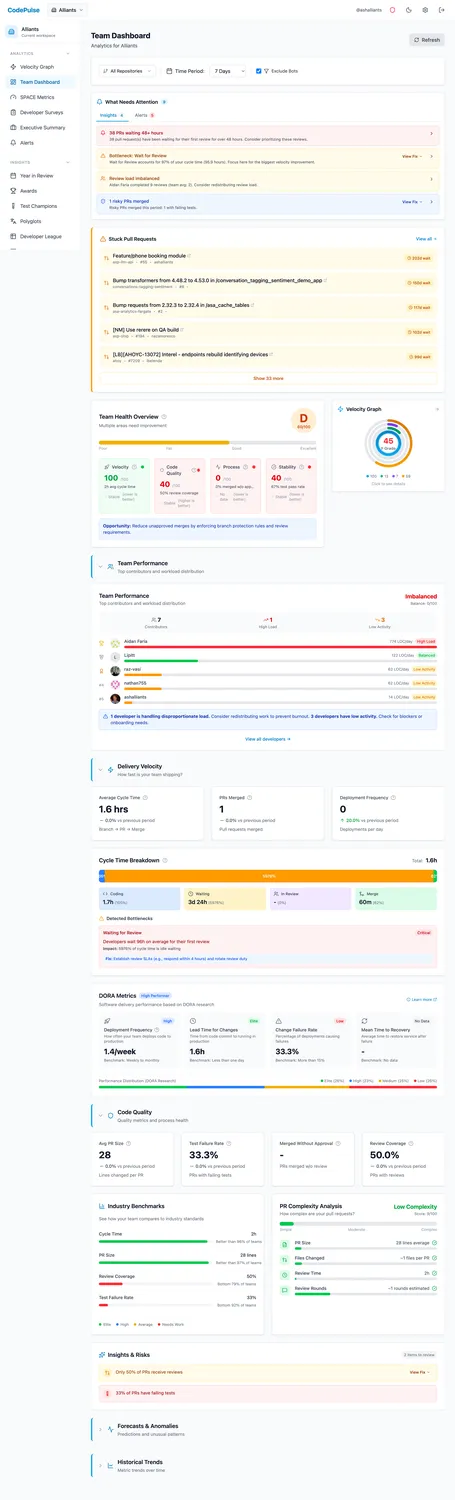
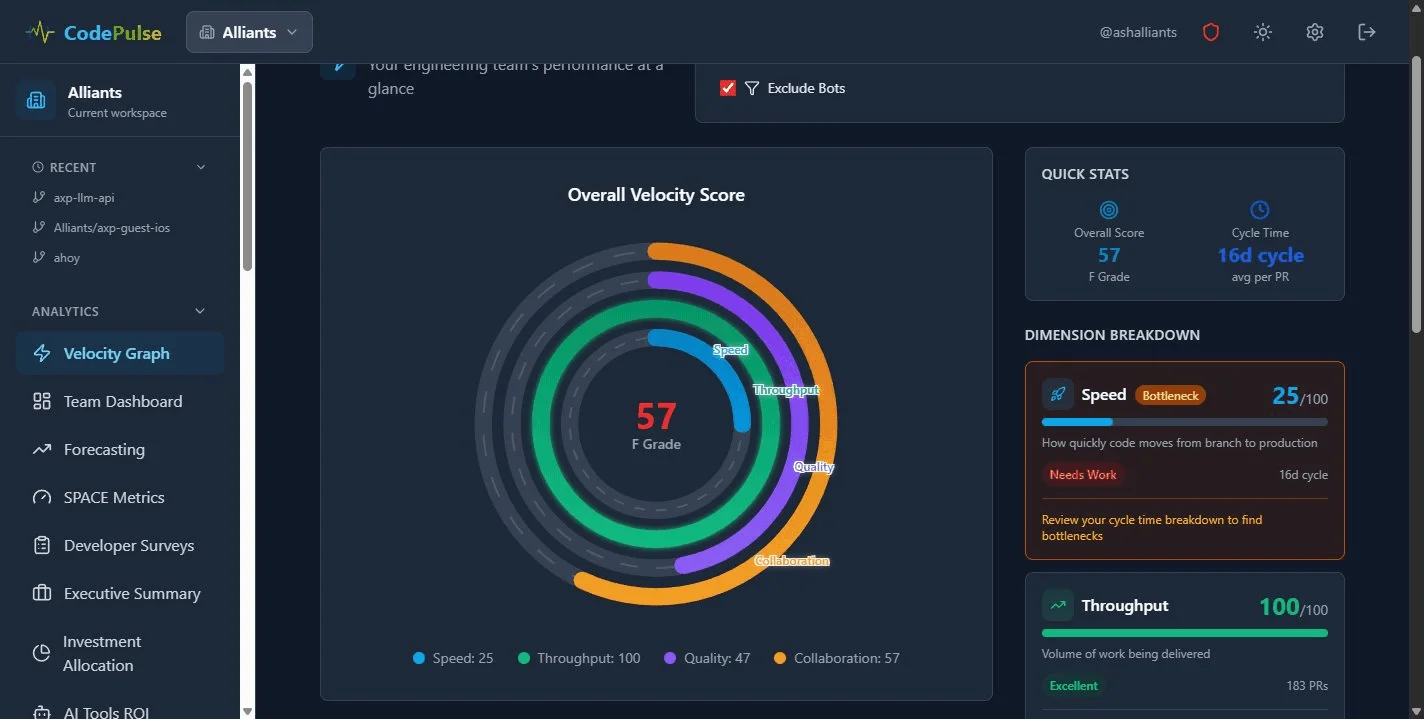
Delivery Velocity
See exactly why cycle time spiked last sprint - whether it's review queues, oversized PRs, or blocked merges. Pinpoint it by team, repo, or week.
On average, 39% of cycle time is just waiting for review. Most teams don't know until they see it.
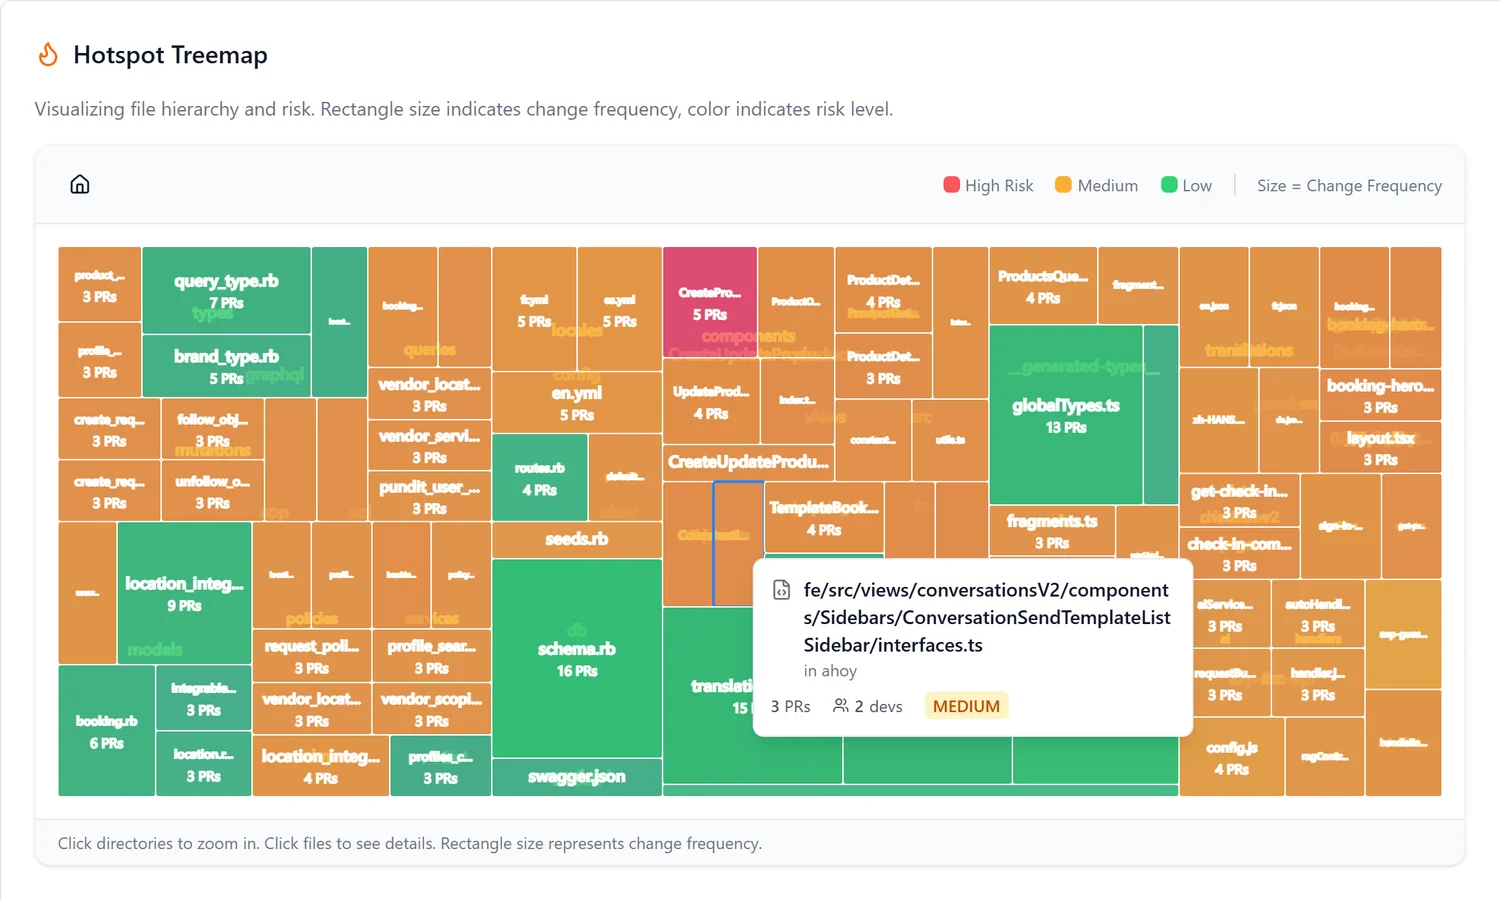
Code Quality & Risk
Find the files that cause 80% of your incidents before the next deploy. See which modules only one person understands. Get alerted before risky changes ship.
1 in 5 PRs merged without approval. 39K+ file hotspots identified across teams.
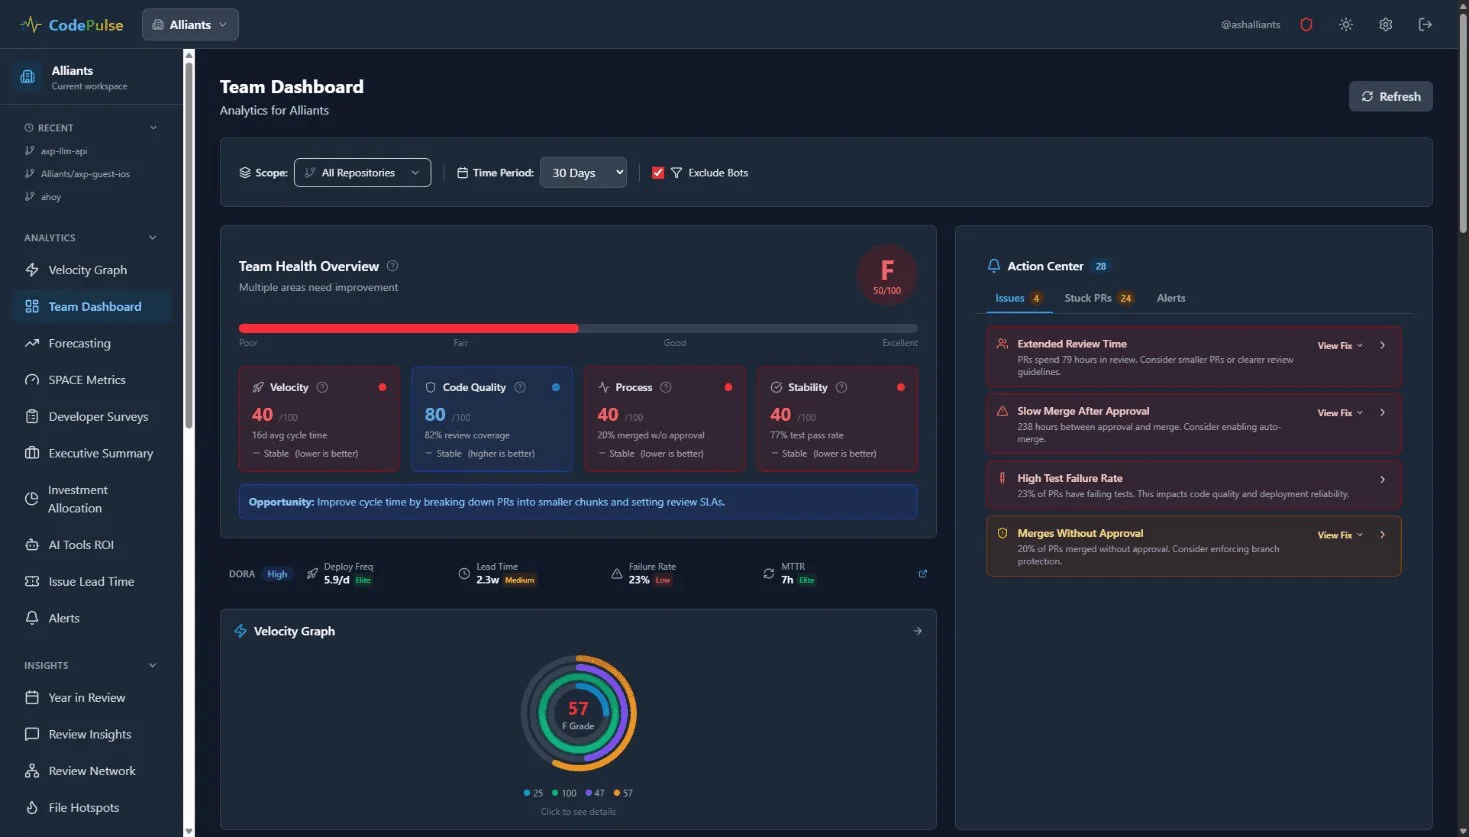
Team Health
See how review load is shared across the team so you can rebalance before anyone burns out. Surface workload imbalances that standups miss - measured at the team level, to support people, not rank them.
"We found review load was piling on one person. Rebalanced it in a week." - VP Eng
Engineering Intelligence
Board-ready summaries of where engineering capacity actually went last quarter. Track AI tooling ROI and investment allocation across teams without spreadsheets.
57% of engineering time is invisible to leadership. Stop reporting from gut feel.
Analytics your developers won't resist
The biggest barrier to engineering analytics is not the math. It is developer resistance. CodePulse measures teams and systems, not individuals - so leaders get visibility and developers get a tool they trust.
Teams and systems, not individuals
Our deepest signals - review networks, knowledge silos, bus factor - measure how the system works. You cannot fake a bus factor, and we never use them to rank people.
Developmental, not evaluative
Individual views exist for coaching and better one-on-ones, never for stack-ranking. The goal is to help the team improve, not to grade the people in it.
Backed by research
A 2024 peer-reviewed study found that surveillance-style monitoring raised complaints and lowered output. Framing analytics as developmental does the opposite.
What Engineering Leaders Discovered
“I'd been telling the CTO we were slow because of tech debt. Turns out almost a third of our PRs were just sitting there waiting on the same two reviewers. We redistributed reviews and the difference was noticeable within a couple weeks.”
Robert Striker
VP of Engineering at Article Fiesta
“Our retros used to be a blame game - everyone had a theory, nobody had receipts. Now I just pull up the dashboard and it's right there. We found out review turnaround was almost three days on average. Got it down to same-day once we actually saw it.”
Jonathon Turner
Engineering Manager at Ultra Communications
Tried Engineering Analytics Before?
Here's what we do differently.
“Most tools need months to deploy and a dedicated admin to run”
One OAuth click. No agents. No maintenance.
GitHub OAuth, select repos, see data. Auto-syncs continuously. No YAML, no infrastructure, no ongoing care required.
“Enterprise contracts and 6-month proof-of-concepts”
Free up to 10 developers. Self-serve.
No procurement team. No sales calls. Start today with your real data, upgrade when you're ready.
“Last time, my engineers revolted”
Team-level metrics only. Engineers request access.
No individual rankings. No screen monitoring. We surface the blockers frustrating your team — they want this data too.
“Velocity dashboards that never explain the 'why'”
Knowledge silos. File hotspots. Real-time risk flags.
See which modules only one person understands. Catch rubber-stamped reviews and merged-without-approval PRs as they happen — not in a quarterly report.
See for yourself — connect GitHub and judge the data, not the pitch.
Three steps. No agents. No code changes.
No 3-month implementation project. No dedicated admin. Just GitHub OAuth and go.
Authorize GitHub
Securely connect with GitHub OAuth. We only request read-only access to repositories you choose.
We never see your passwords or gain write access to your code.
Select Repositories
Choose which repositories to analyze. You can add or remove repos at any time.
We automatically sync 6 months of historical data.
See Insights
View DORA metrics, cycle times, team health scores, and more within minutes.
Data syncs automatically every 15 minutes.
Built for Teams, Not Surveillance
We built CodePulse because the best engineering leaders don't need to watch people work — they need to understand how work flows through the system. Every metric is team-level by default.
Your Code Stays Yours. Always.
We analyze metadata only — PR titles, timestamps, and review activity. We never access source code, secrets, or credentials.
Common Questions
Quick answers before you connect
We use read-only OAuth access to GitHub. We can see pull request metadata (titles, authors, timestamps), commit history, and review activity. We NEVER access your actual source code contents, secrets, environment variables, or have any write permissions. You can revoke access at any time from your GitHub settings.
Roughly 1 in 5 engineering leaders who see their metrics through CodePulse decide they want ongoing visibility and become paying customers. That's our business model - not selling your data, not ads, just software subscriptions for teams that find value in continuous monitoring. Even if you never pay us a cent, you'll walk away with genuine insights about your engineering organization.
This is the most common concern we hear, and honestly -- most teams welcome it. CodePulse shows team-level patterns, not individual surveillance metrics. There's no keystroke tracking, no screen time, no individual scoring. What engineers actually see is where their PRs get stuck, who's overloaded with reviews, and whether the process is working. Those are frustrations they already have -- CodePulse just makes them visible. Several of our teams were set up by the engineers themselves, not management.
Within 5 minutes of connecting, you'll see your Engineering Health Score and basic metrics. We automatically sync 6 months of historical data, so trends and comparisons are available immediately. Data refreshes automatically every 15 minutes after that.
Yes! CodePulse works with both public and private repositories. The OAuth permissions work the same way - we only access the repositories you explicitly choose to connect, and we maintain the same strict read-only access and encryption standards.
You have full control. You can delete all your organization's data with one click from the settings page. You can also revoke OAuth access directly from GitHub (Settings > Applications > Authorized OAuth Apps). Once deleted, your data is permanently removed from our systems.
Your Board Asks “Why Are We Slow?” Have the Answer Ready.
Connect your GitHub and get your Engineering Health Report in 15 minutes.
Free up to 10 developers · Pro from $149/mo (annual) · View all plans